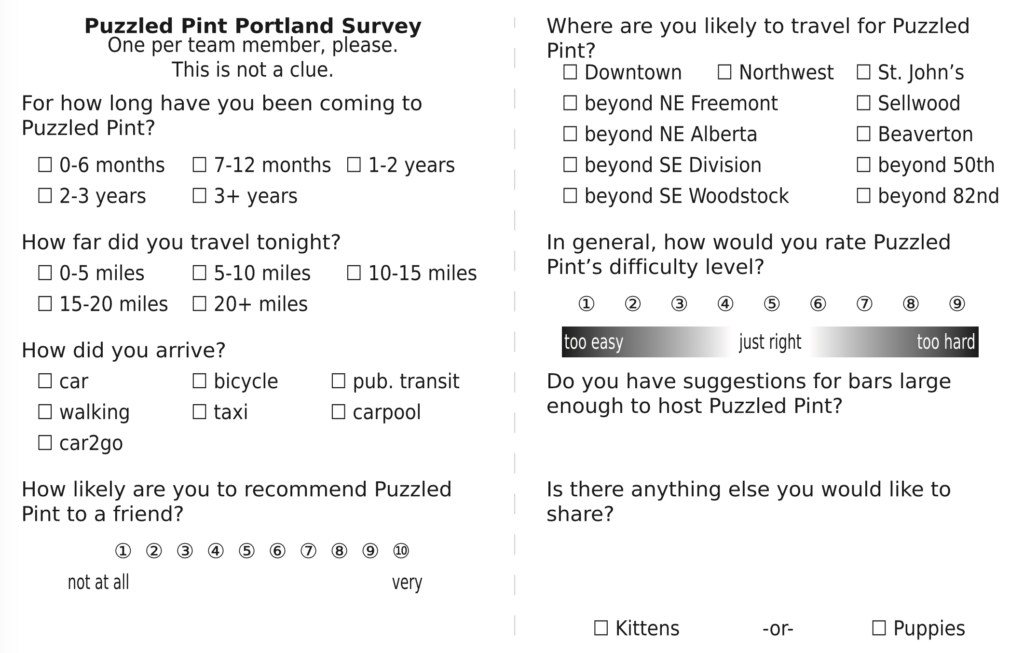
Back in ye olden days of 2015, the Portland Puzzled Pint Game Control put together a small survey. We wanted to collect demographics, suggestions, and threw a couple of fun questions in there. It was really fun and interesting, but it’s been 8 years. It needed an update. I made some tweaks to the questions and circulated it to players during our May event in inner SE Portland.
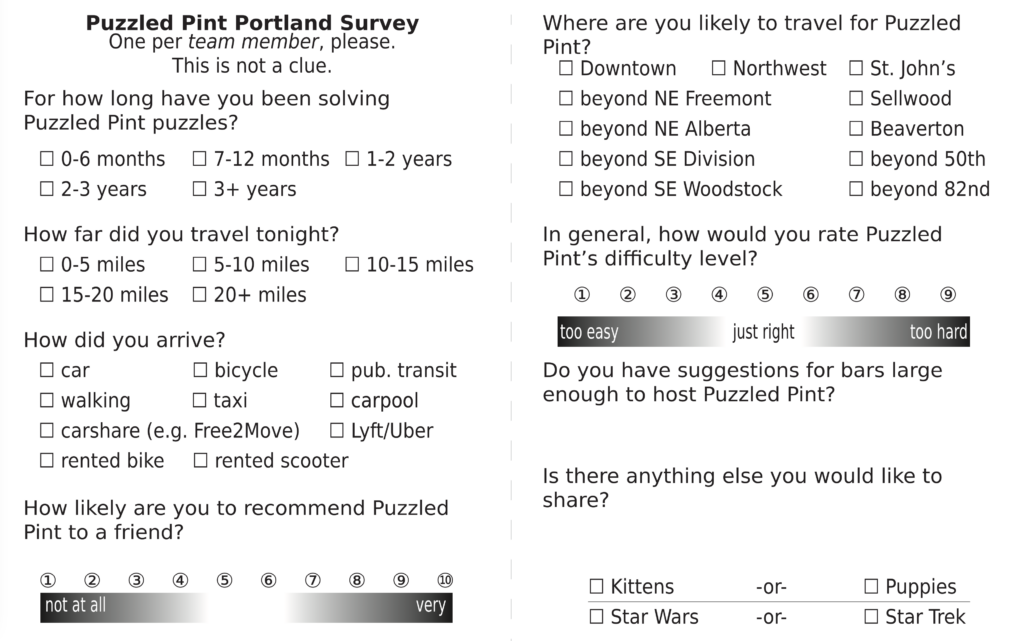
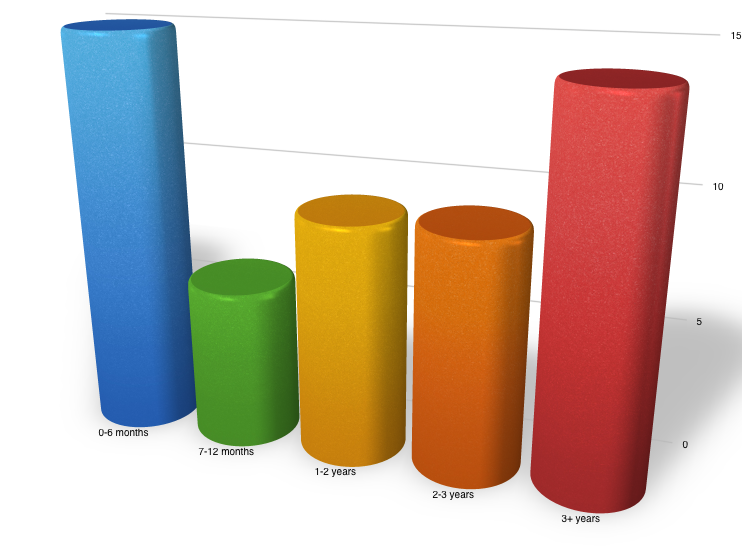
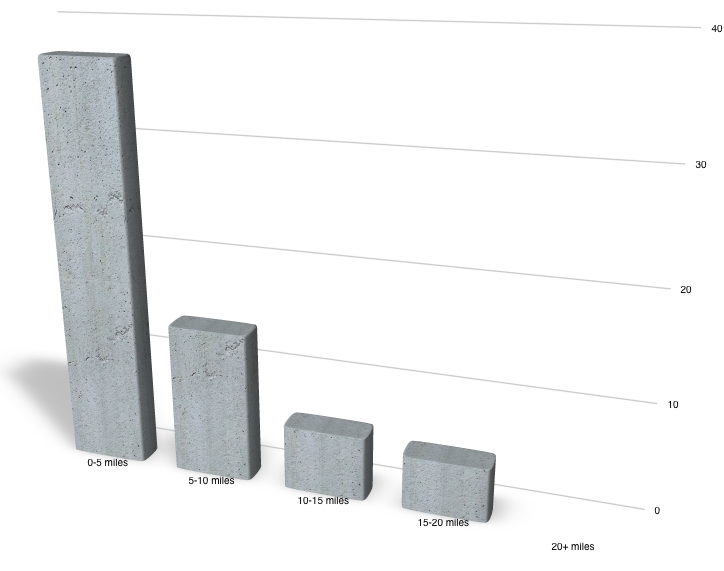
The opening question was about the duration that folks have been attending Puzzled Pint. This question had some minor wording tweaks from the original. How long have you been “attending” switched to “solving” because… *gestures wildly around in the general direction of the past three years*.
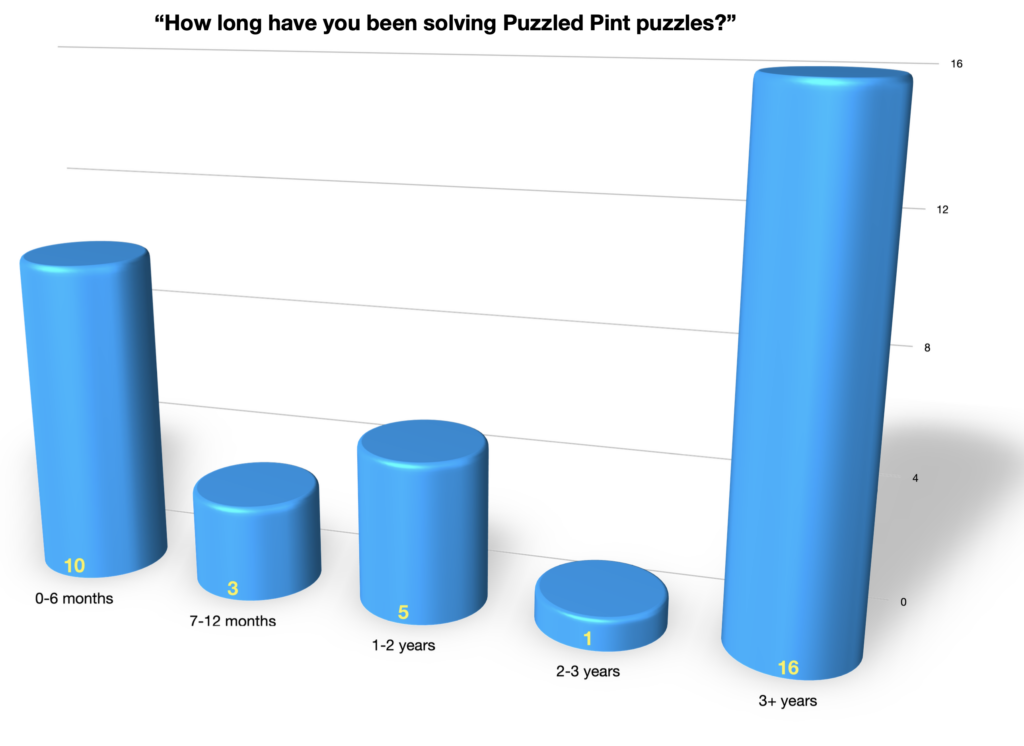
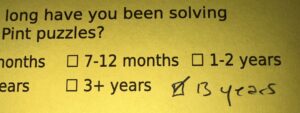
This shows that we have some long-time regulars. But it also shows we’ve had some wonderful new people discover Puzzled Pint Portland since we returned to in-person events. Welcome! And may you slide your way up toward the right of the graph. One person, who got counted as “3+ years” had a write-in entry:
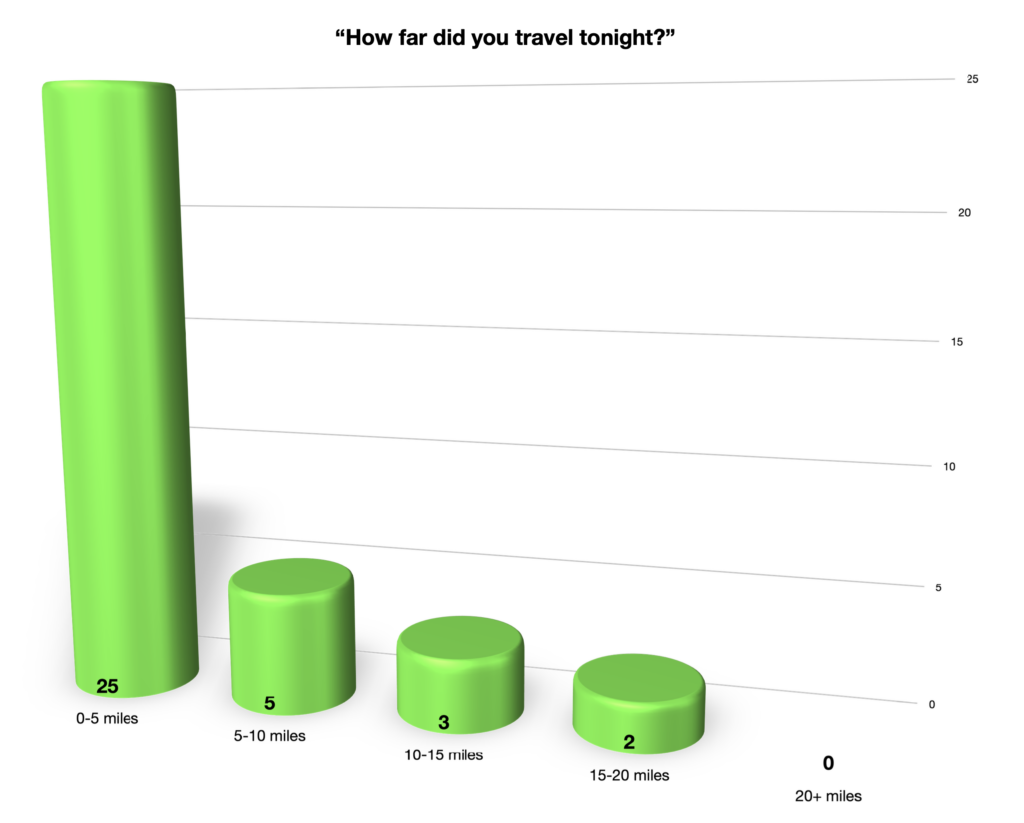
Let’s check out the stats on distances and transit. Portland is a small “big city” and the travel distances and methods reflect that. The answers show that the vast majority of people came in to the event from 5 miles or less. (Aside: that could mean they live that close, or it could mean they work downtown and jumped across the river.)
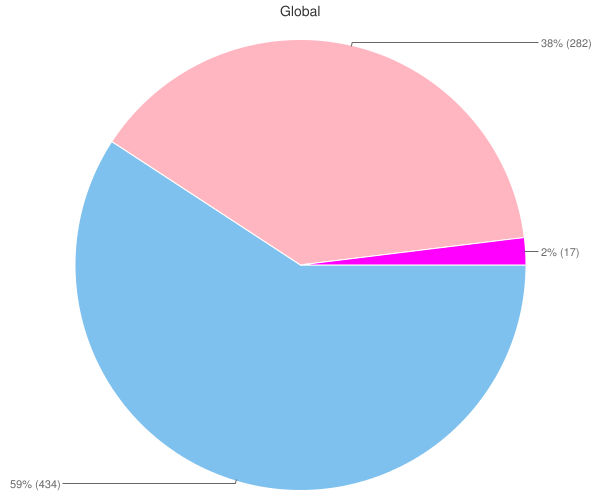
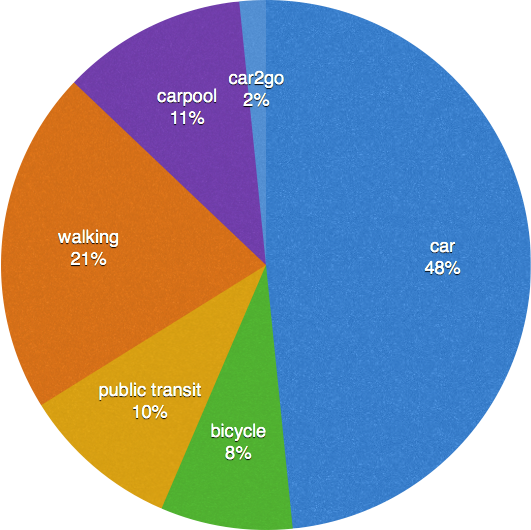
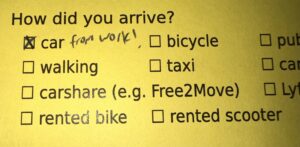
Portland has a healthy public transit system (at least, compared to the rest of transit in the US) and a great bicycle infrastructure. We waned to find out not just how far away people came from, but what method of travel they used.
Three quarters are still cars, though a nice chunk of that was carpooling. The number of walkers surprised me — I’d expected the wedge size to be flip-flopped. But it was a nice day, and a walk of 0-5 miles isn’t bad. (Me, personally? I ended up walking a mile and a half from downtown and got a gorgeous view off of Hawthorne Bridge.)
One bit of marginalia defended that they came by car “from work!”
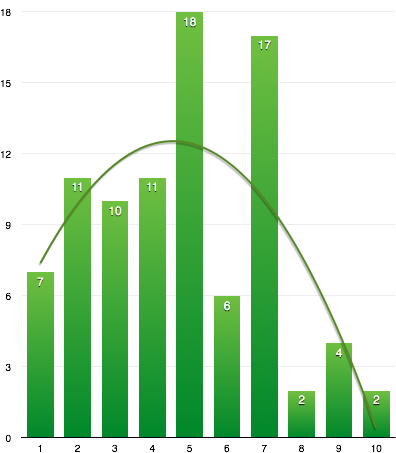
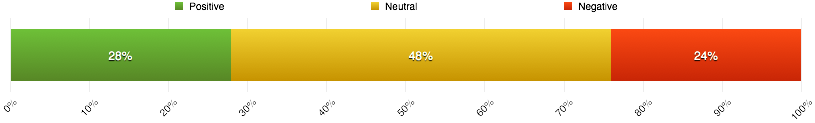
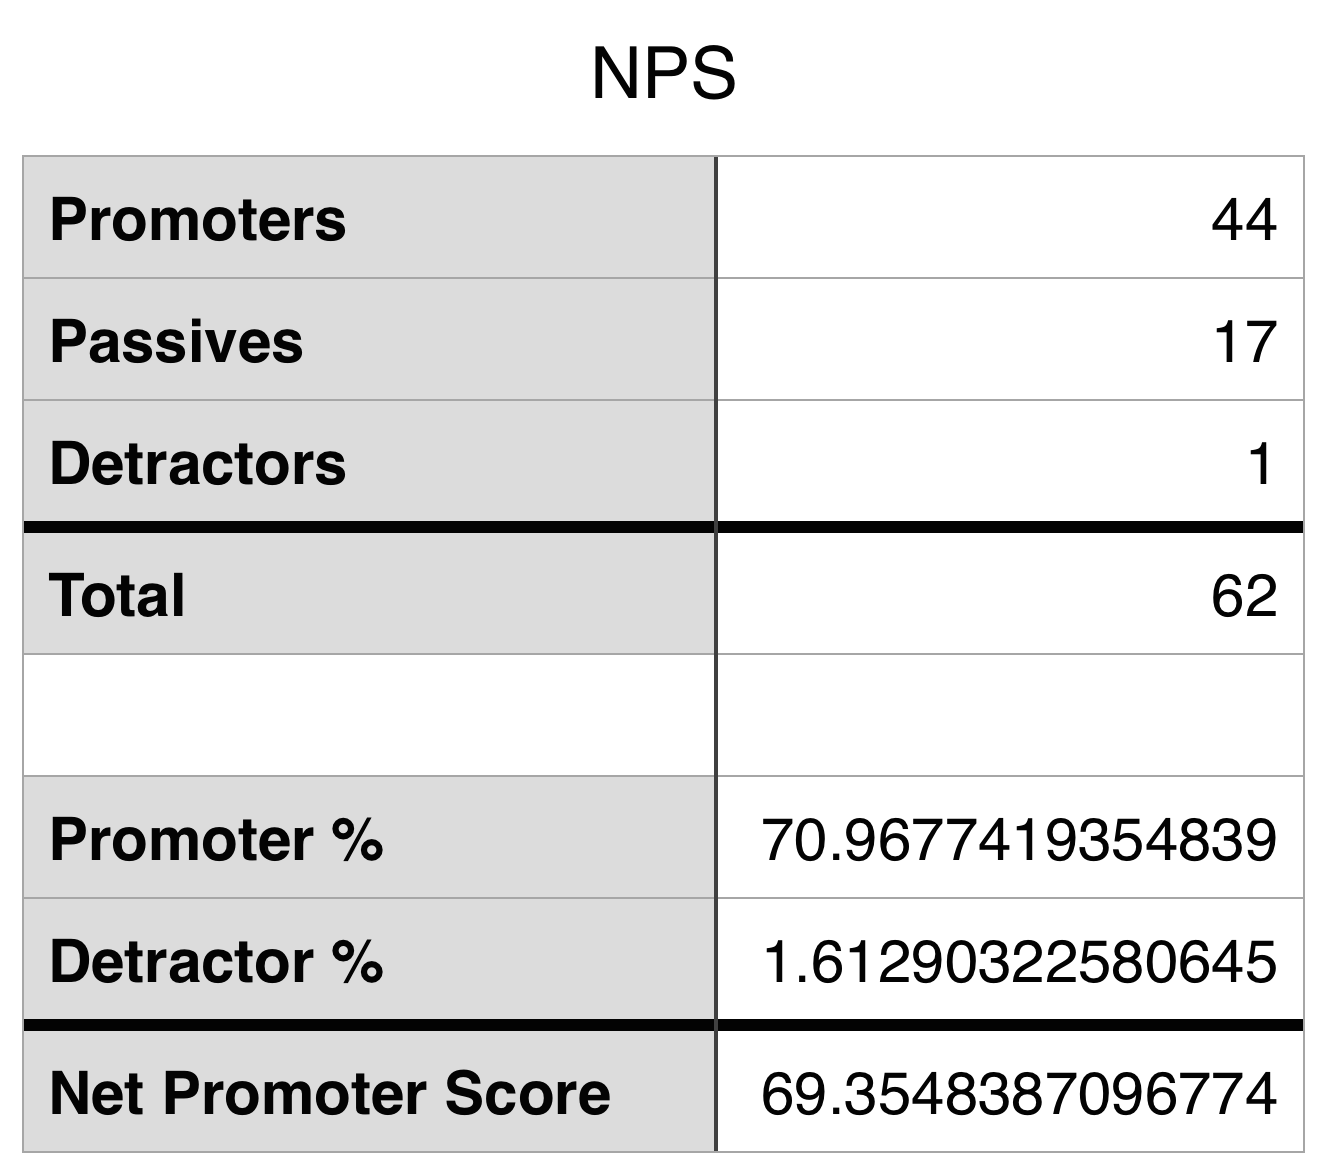
The company I work for used to do customer satisfaction surveys by a methodology called Net Promoter Score. There is both some math and some hand-wavy-magical-reasoning involved, but the gist is that you ask this “recommendation” question and people who answer 9–10 are positive, 7–8 are neutral, and the rest are negative. This shows that folks still like Puzzled Pint!
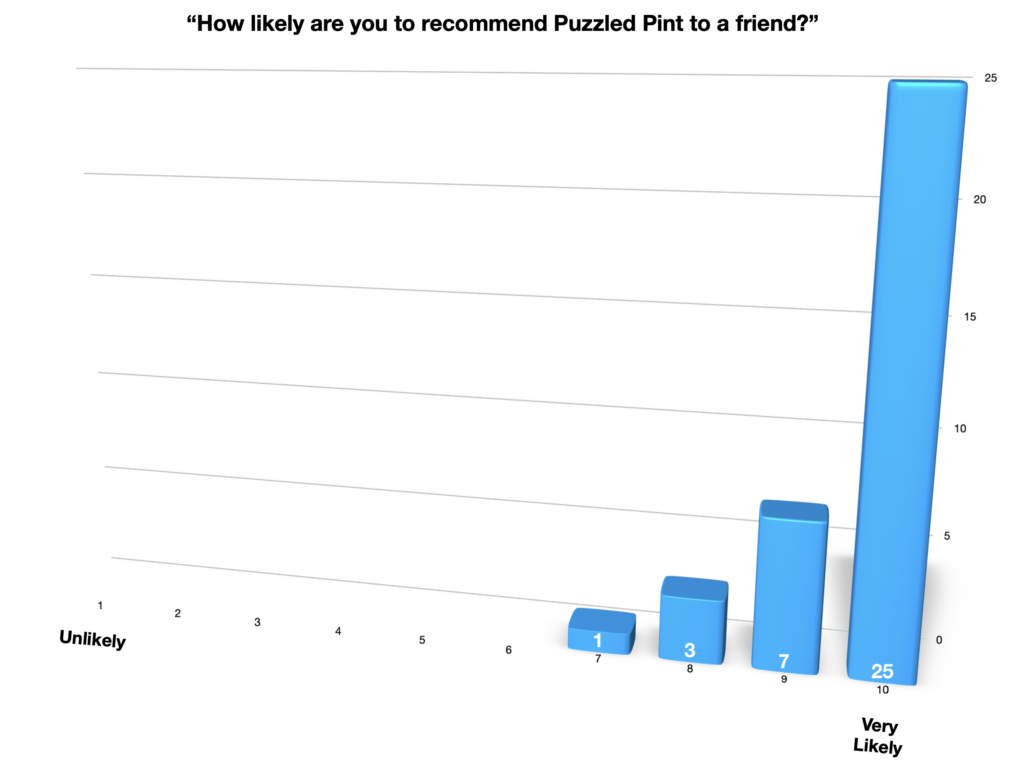
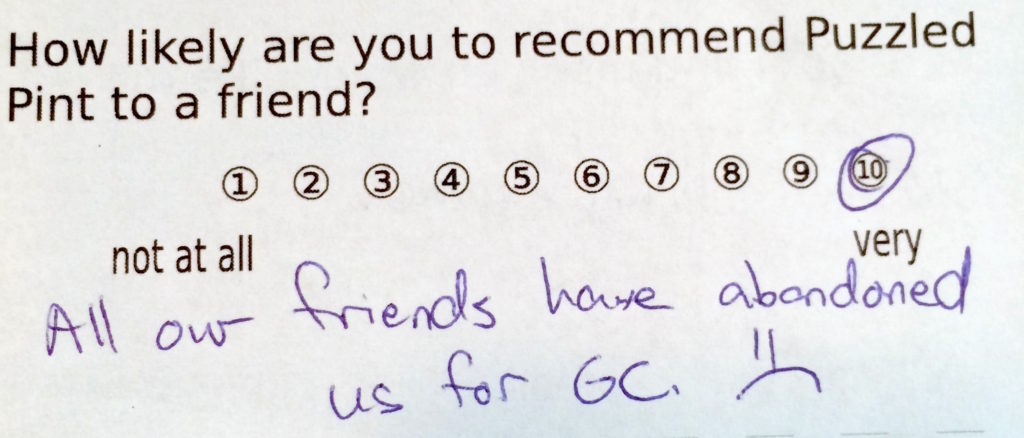
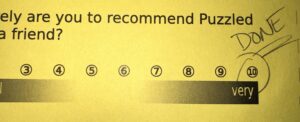
And someone likes it so much that they’ve already recommended it to a friend!
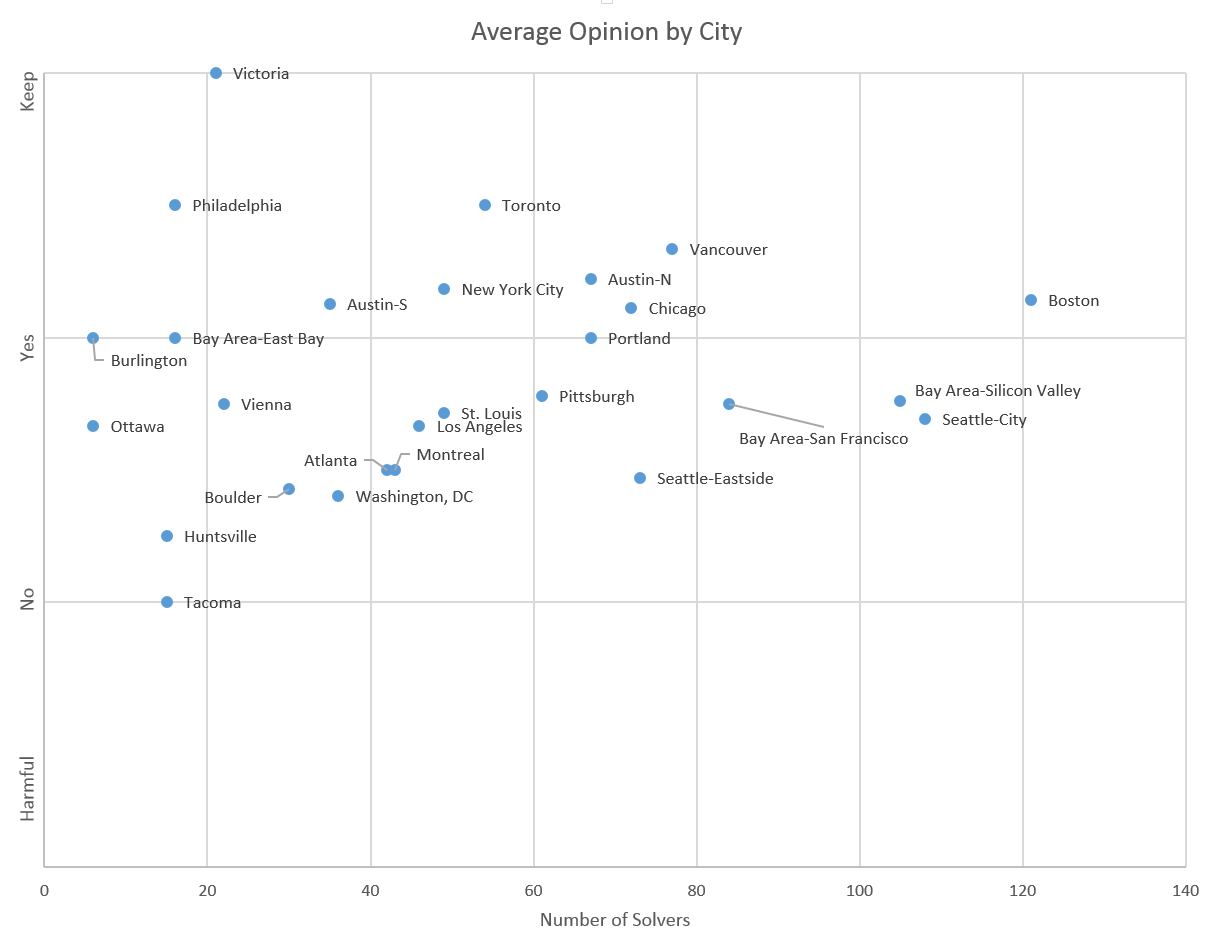
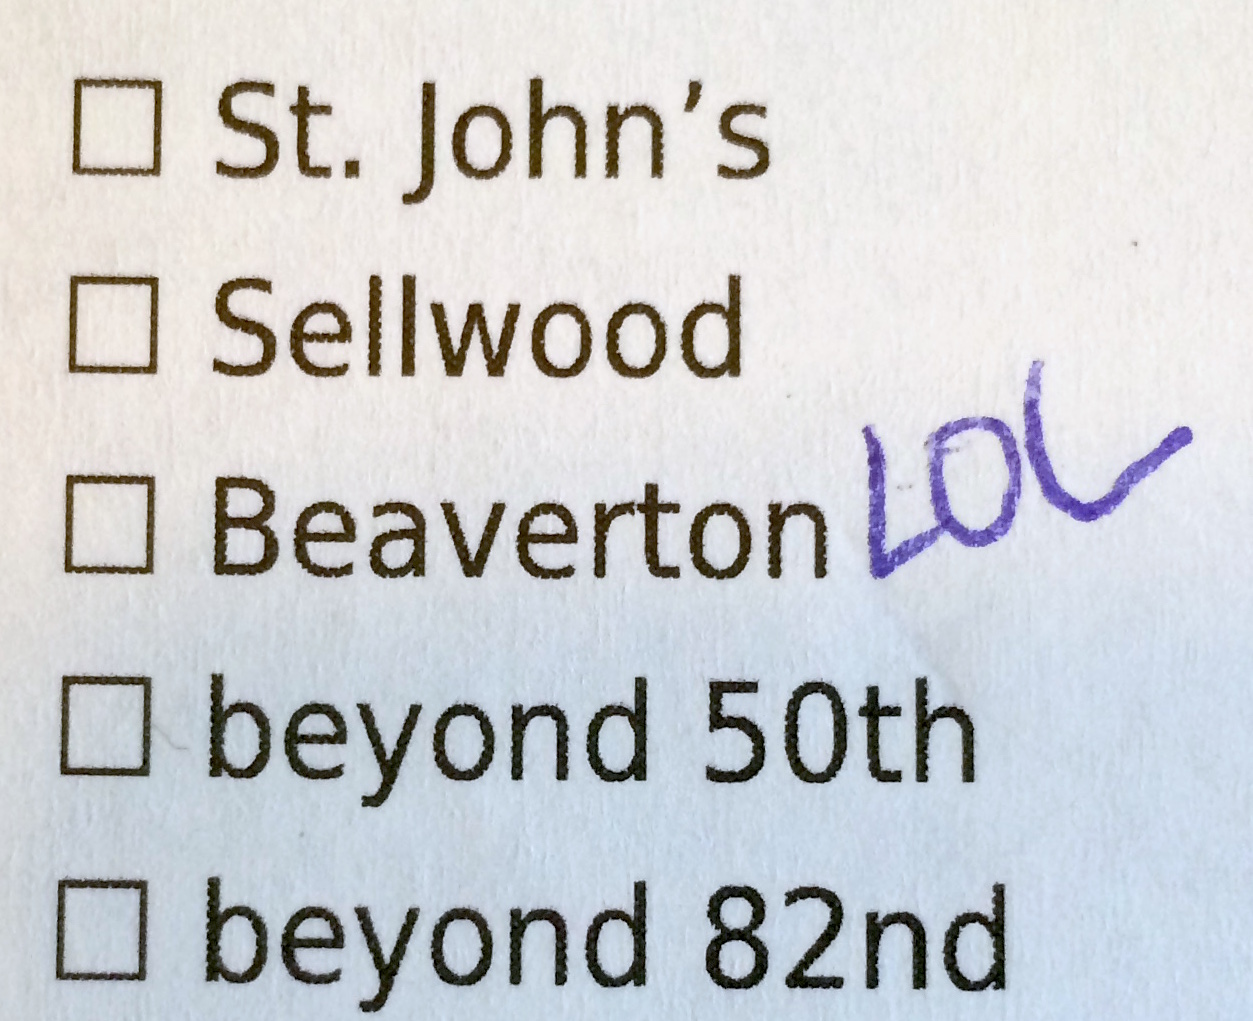
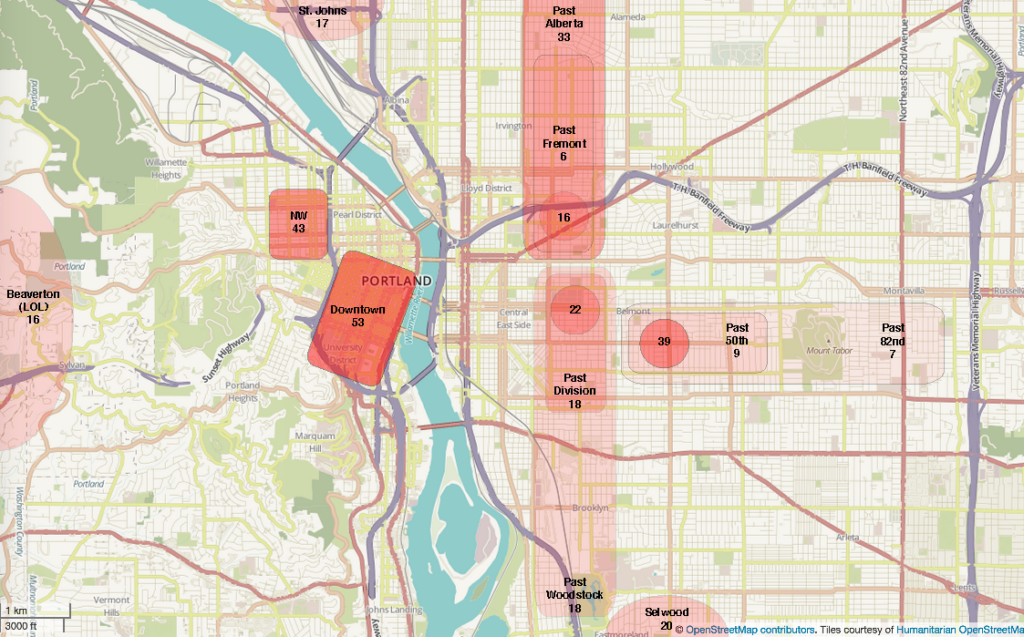
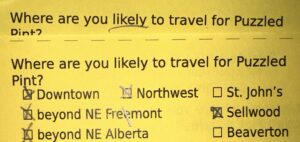
Next up, we asked about neighborhoods. This question helps us refine where to look for bars. Spoiler alert: everyone on the current GC team lives in SE, so we tend to bias toward that quadrant. But it’s good to get a feel for where folks are willing to travel. You can see it tapers off as you go east/west, and even a bit north/south. Between this and suggestions for bars (a later question we’ll see in a bit), we can get a good idea of places to scout. As our size increases, as more people get comfortable returning to in-person events, finding locations does become more difficult. In our peak, pre-pandemic, we needed places that could hold 120 people. At present, we’re about half that, which does open up more possible locations.
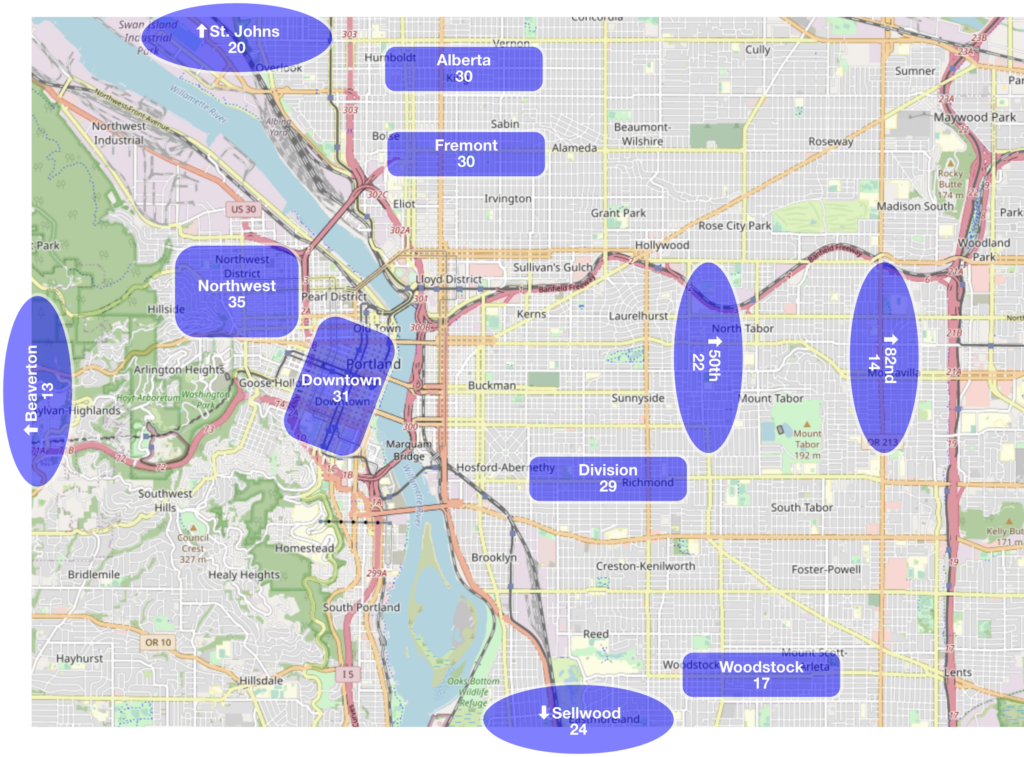
Putting on my data-analysis cap, I can’t deny that the opinions neighborhoods might be a little self-selecting, since we’d picked a bar in inner Southeast. Folks from Beaverton who didn’t want to travel to SE wouldn’t have been represented, etc. But hey! If you’re from Beaverton and would like to start up a local chapter for folks out there, please contact game control!
For what it’s worth, the location question was copy-pasted from the previous survey. I didn’t notice Fremont was misspelled last time. And so it was this time.
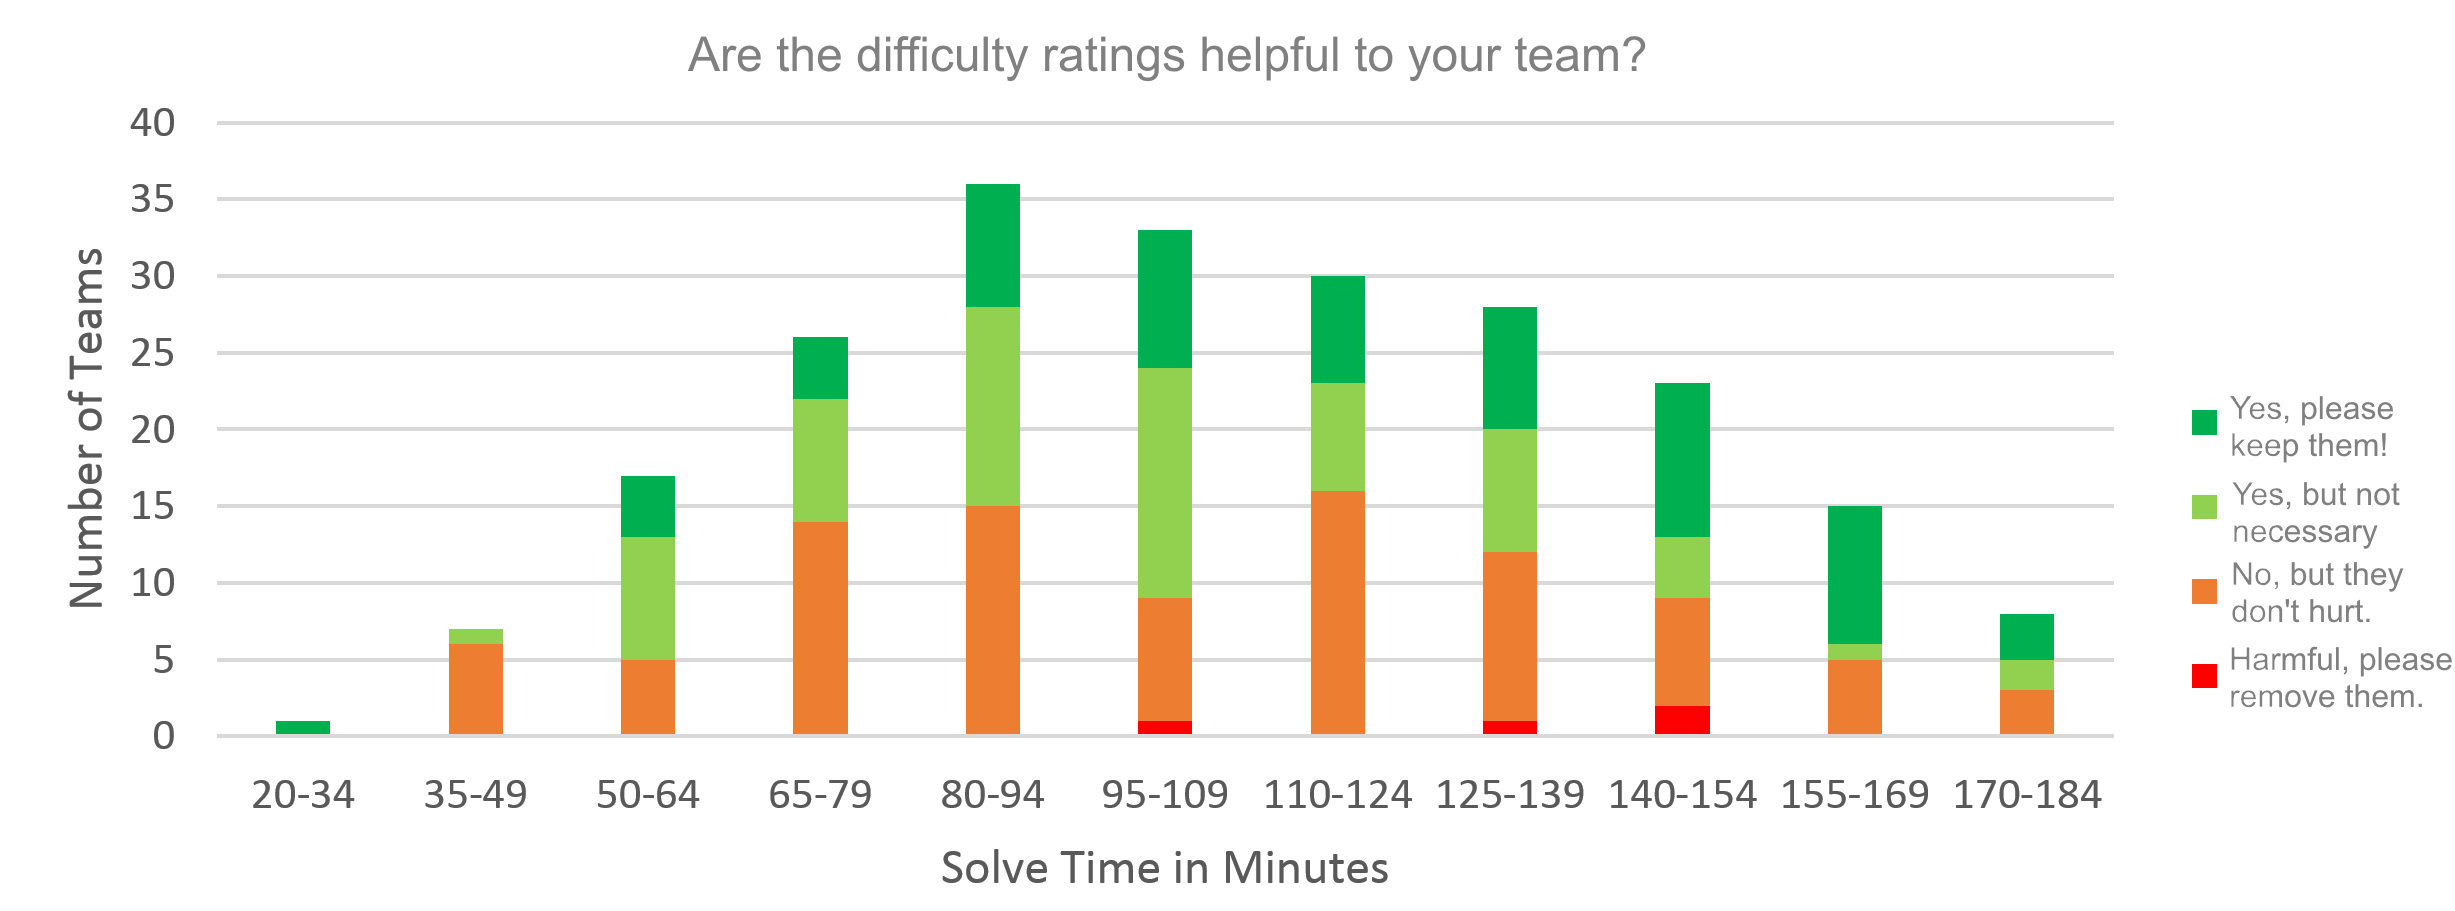
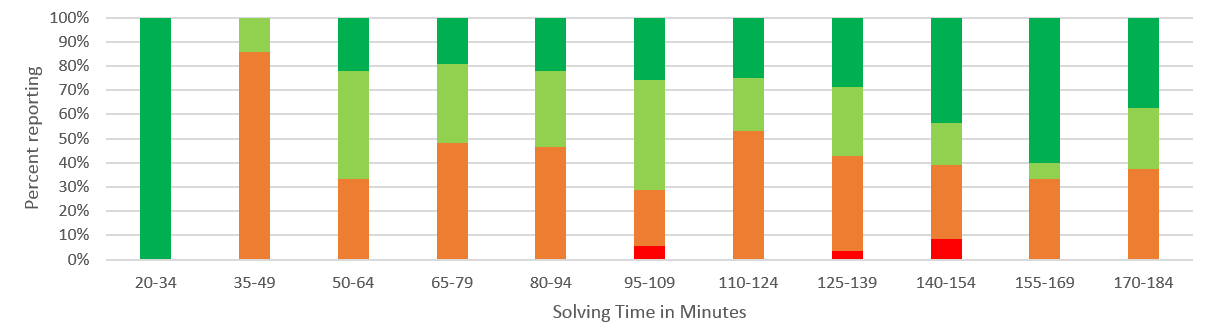
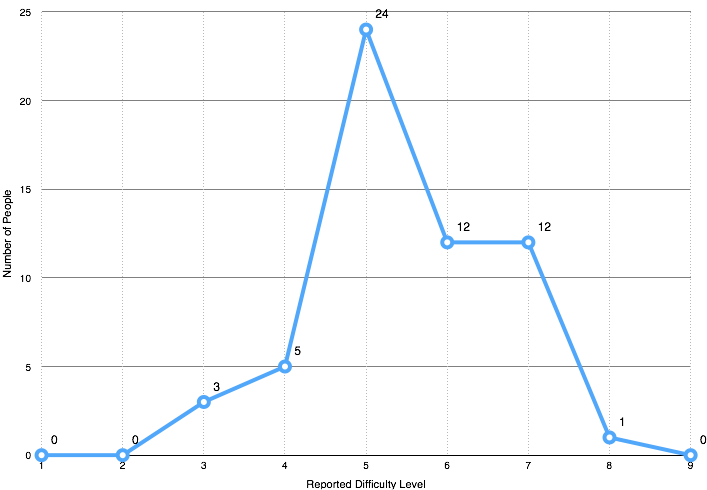
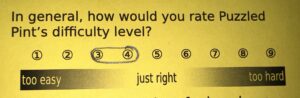
We strive to make Puzzled Pint puzzles accessible to beginners. And I think we do end up fulfilling that promise. But there’s a pattern that repeats. As the beginners get familiar with Puzzled Pint, the format of puzzles, and strategies for solving, the “just right” puzzles start to feel a little too easy. In the past, we’ve had folks want to spin up a “Puzzled Pint, but with more difficult puzzles.” And that’s certainly something we’d encourage a motivated person to do. (And hope it’s an event that the GC could attend as players, much like DASH.) But that just-right-to-too-easy pipeline is a struggle.
Oddly, the data from this survey shows quite the opposite. And I’m curious as to why. I’m afraid I don’t have any theories. Could the puzzles actually be too hard? Hinting too obtuse? Not enough new folks are reading and understanding the “Puzzling Basics” handout on the back of the code sheet? I don’t know, but I’m open to hearing your own theories.
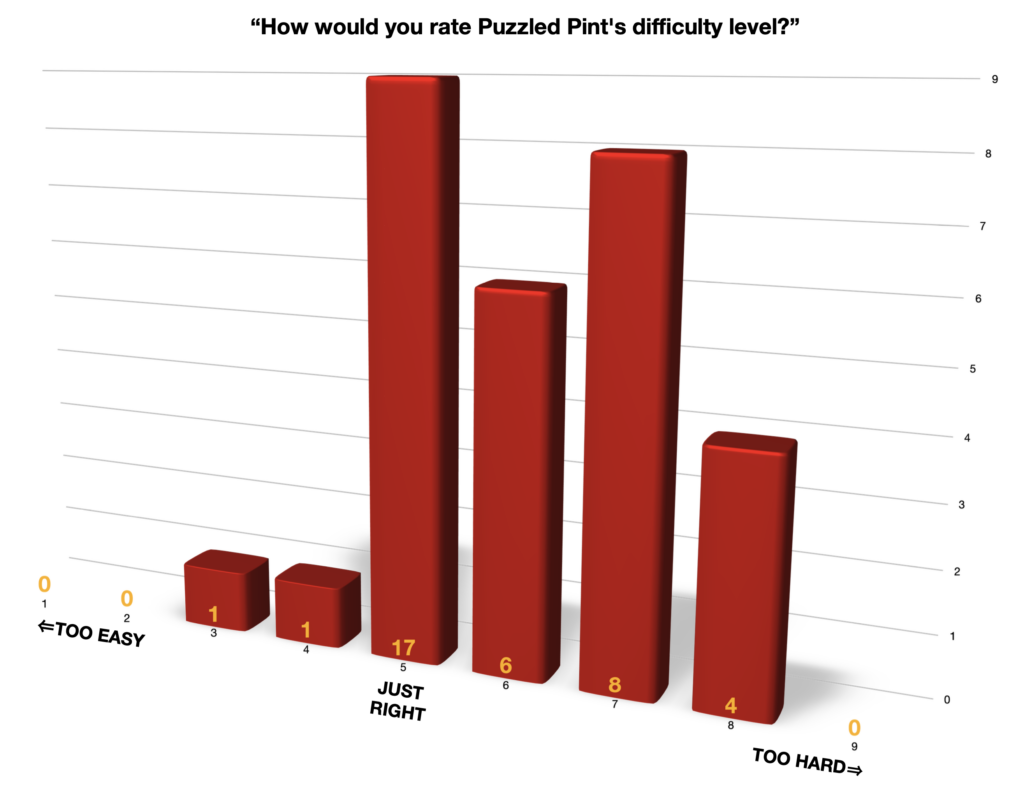
Always — we appreciate fun write-in comments in the margins. But much like the “13+ Years” write-in above, we do have to normalize the actual answers people give. For instance, what do you do with someone who circles two? In this case it got rounded down to 3, which is more of an outlier than 4 would have been.
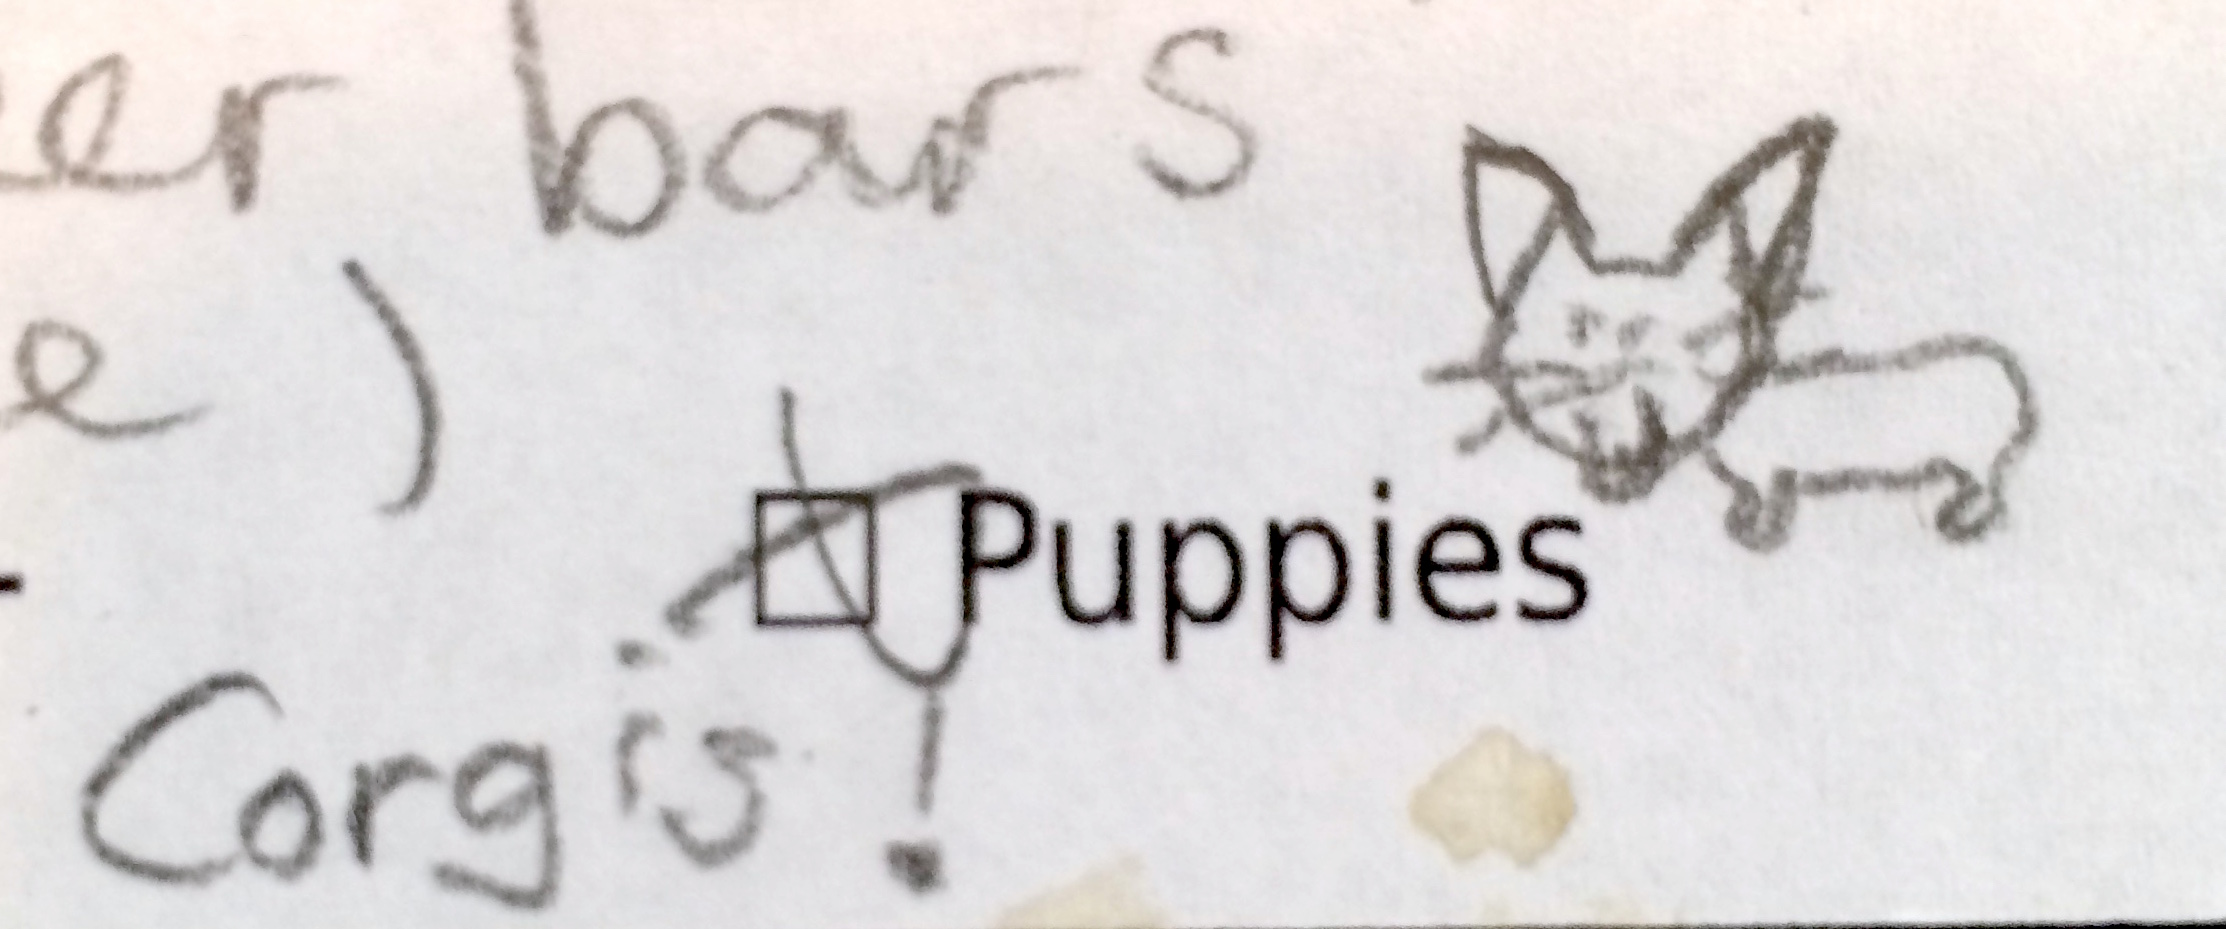
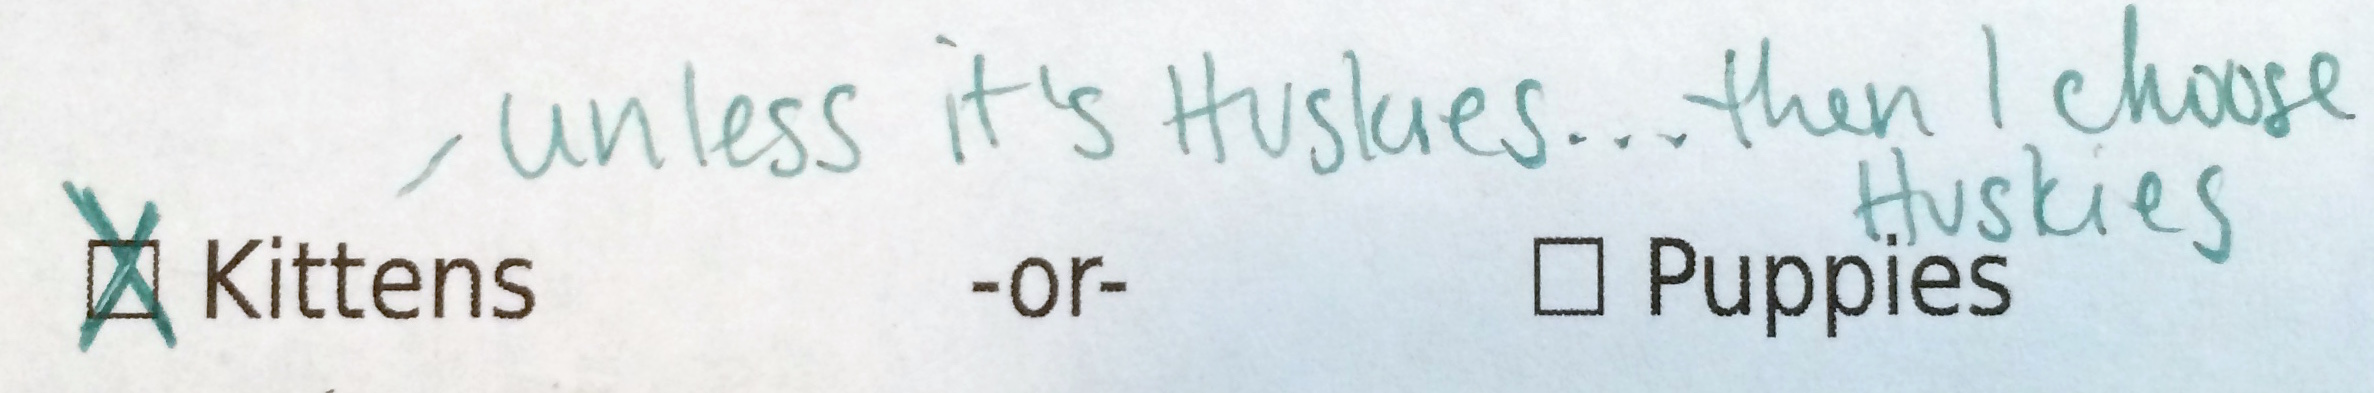
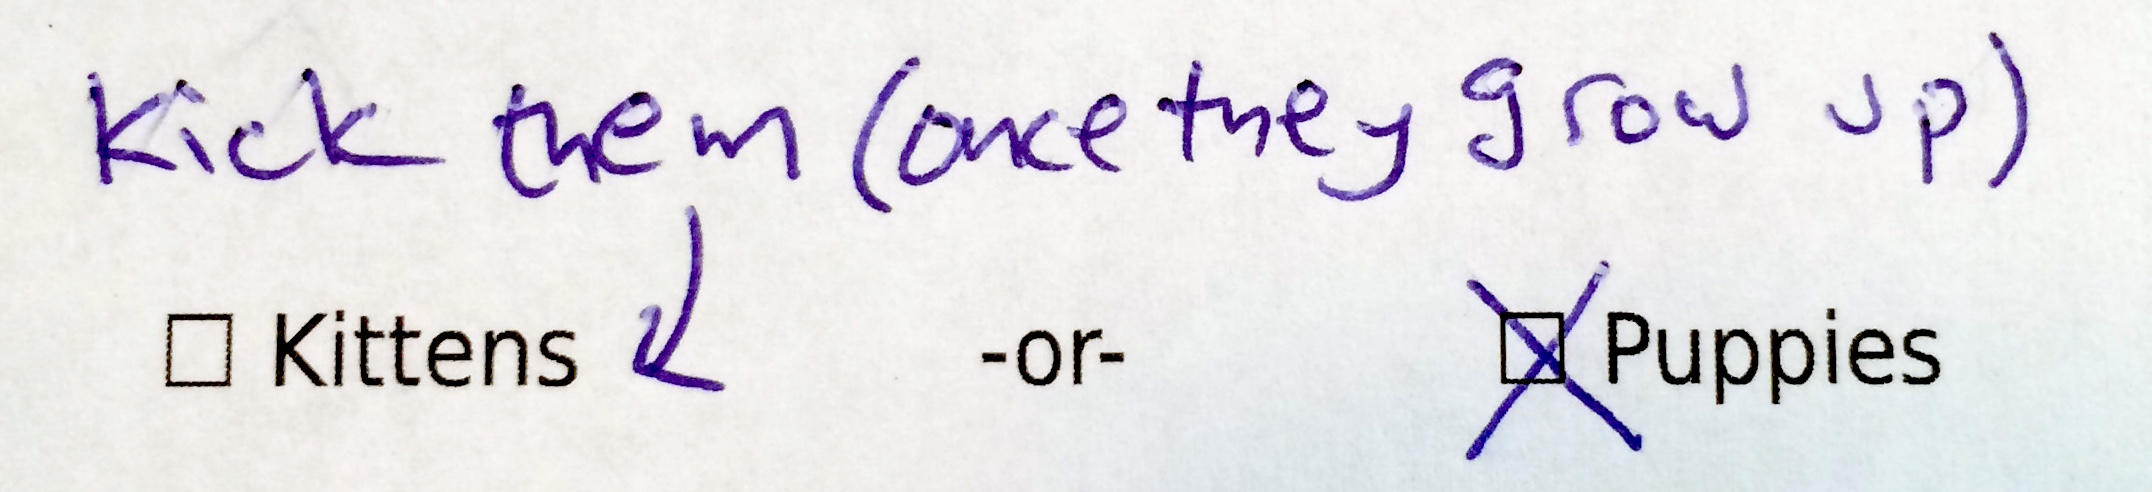
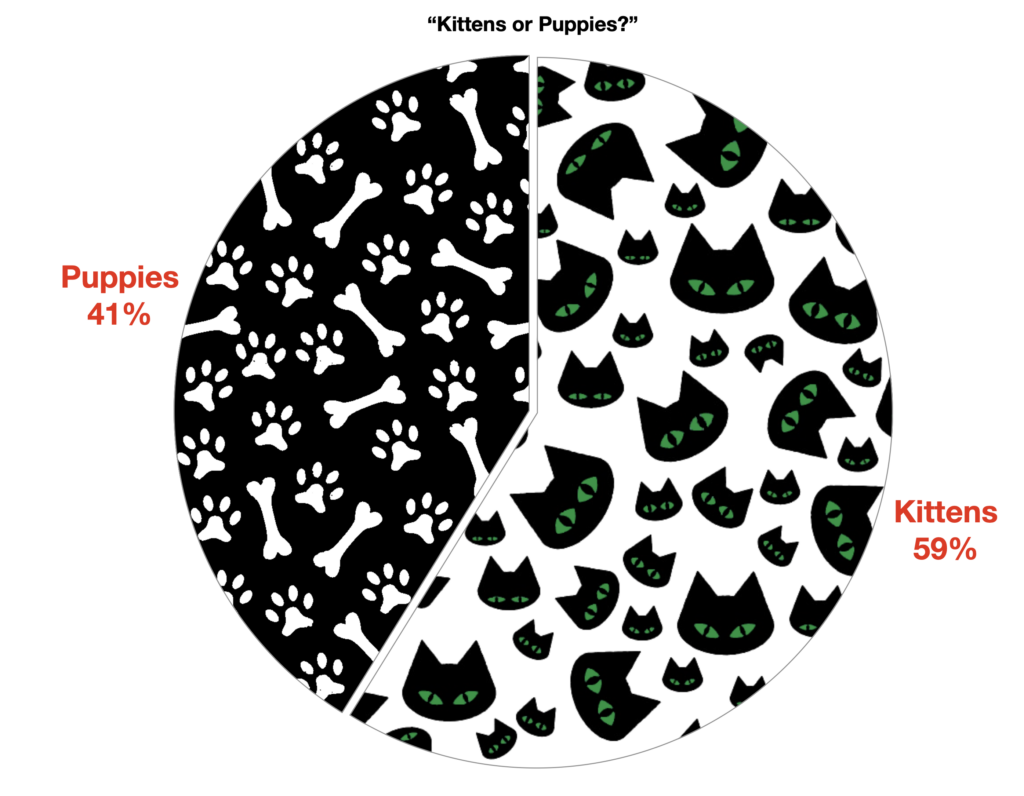
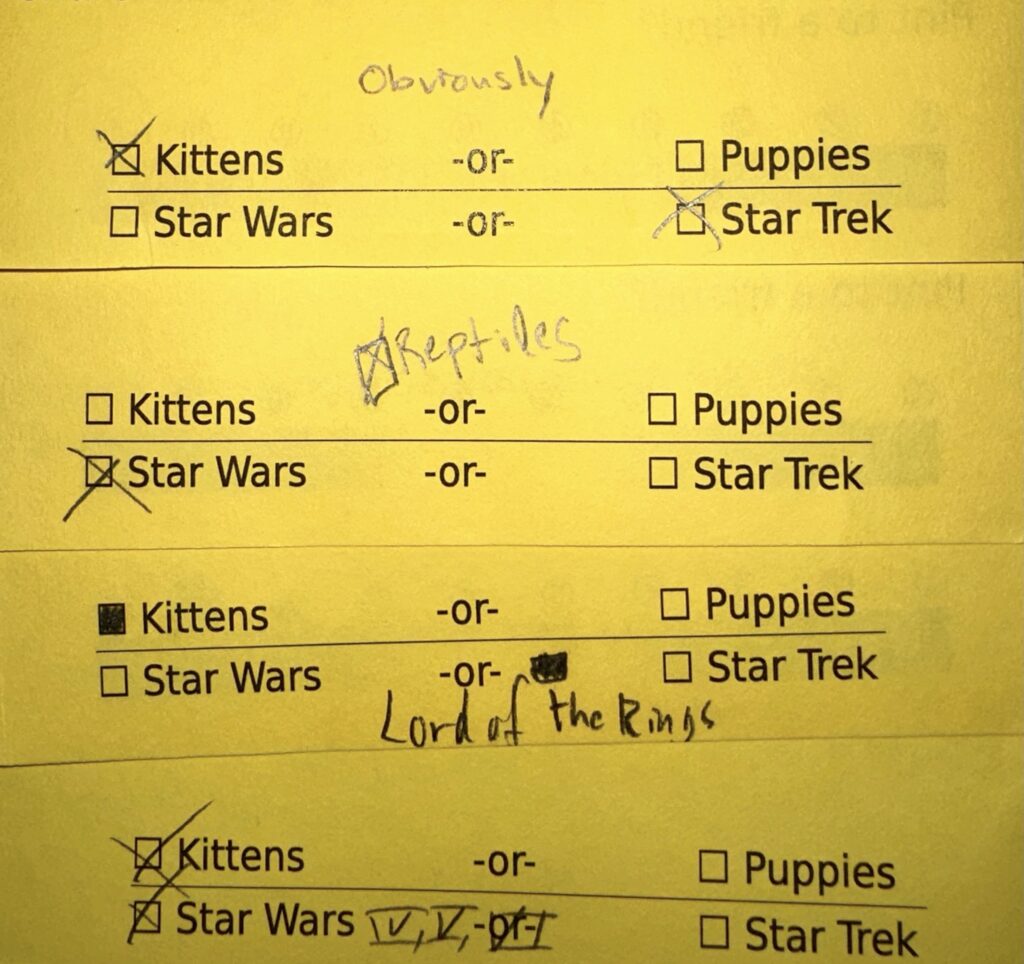
When we last ran this survey, we had a simple and fun final question: kittens or puppies. Puppies won out by a nose. This time, we flipped to kittens. Make of this what you will.
We’ve had a renaissance of both Star Trek and Star Wars since our last survey, so I thought I’d also capture that opinion for the fun of it.
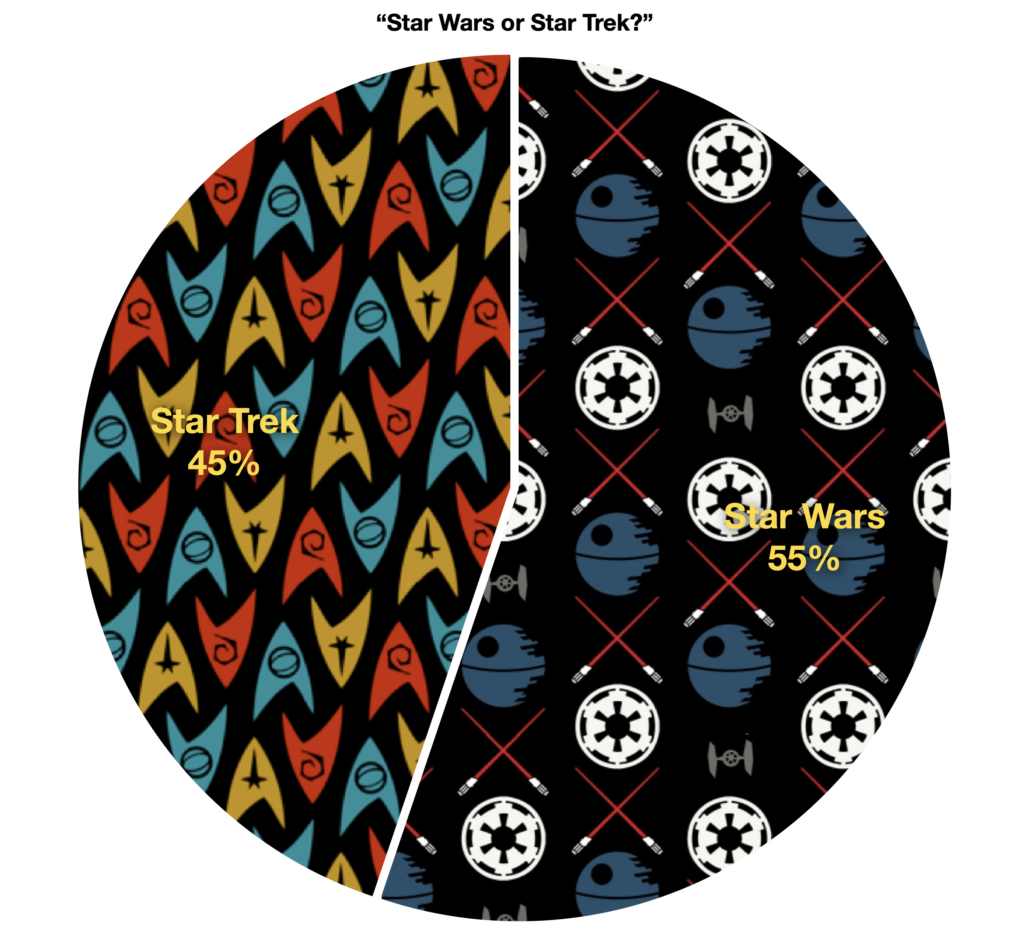
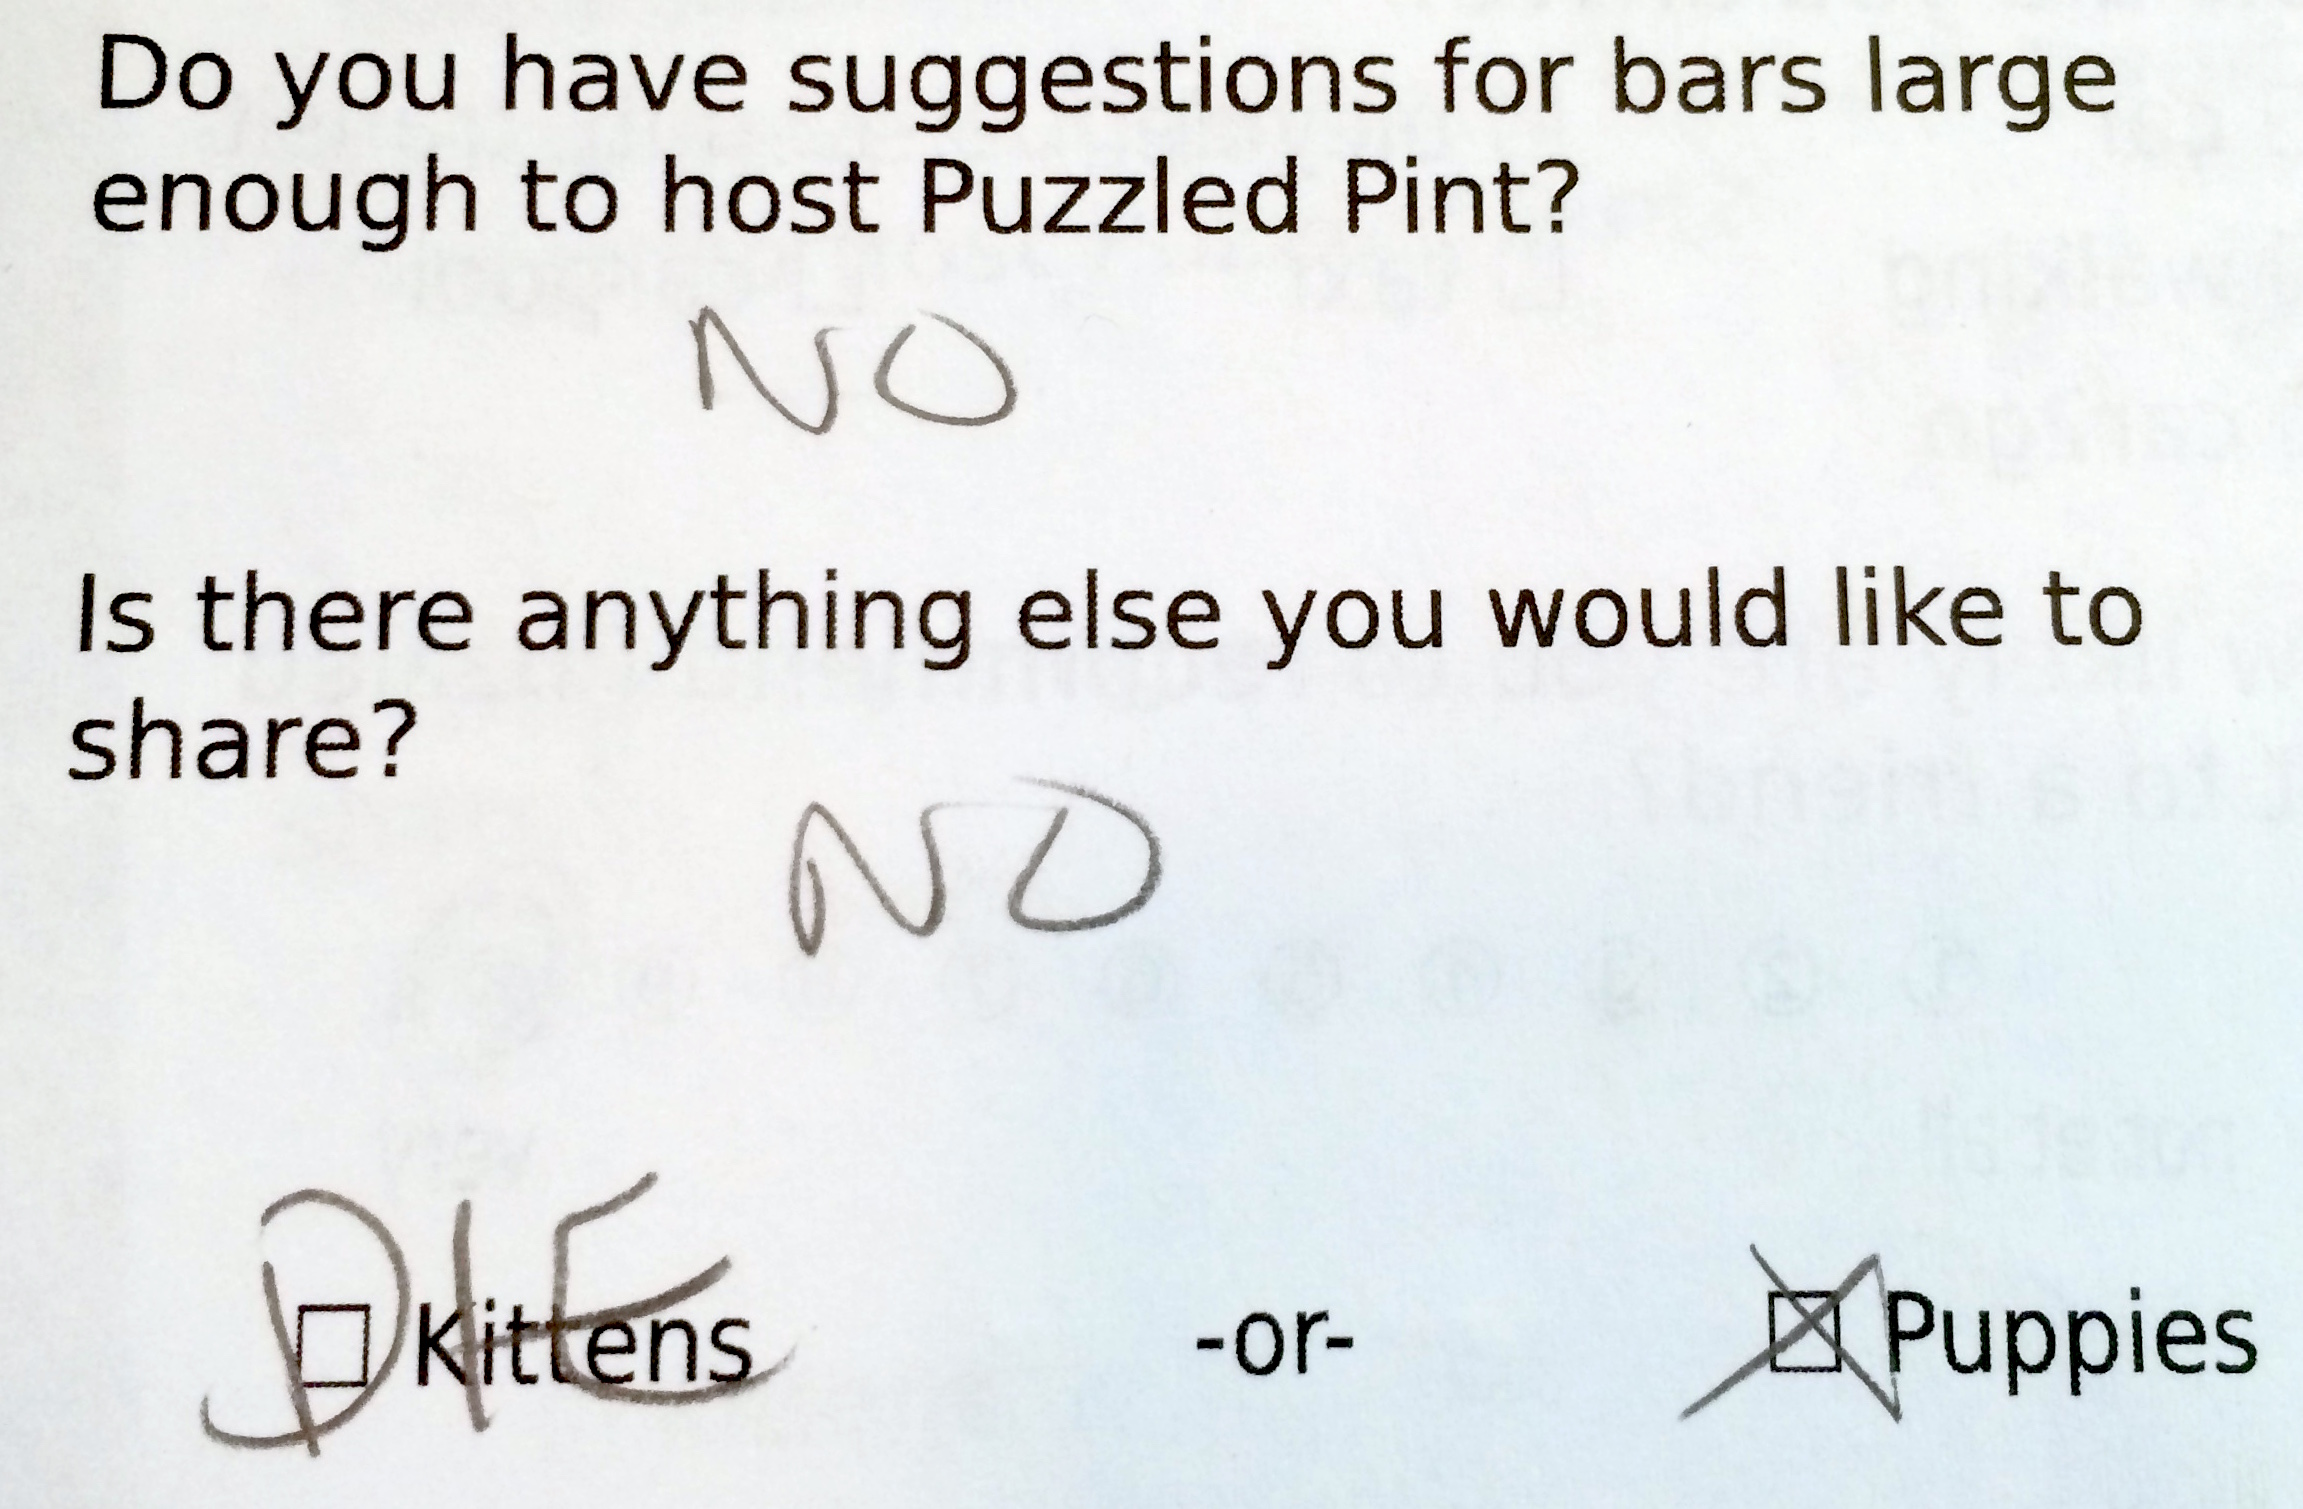
There were certainly some outlying opinions.
The question about bar-suggestions elicited several responses:
- Deeply Rooted + Hi-Top, up off of Fremont Street.
- Tough Luck, up near Columbia in NE Portland
- Steeplejack in SW Portland
- Bye and Bye in NE Alberta
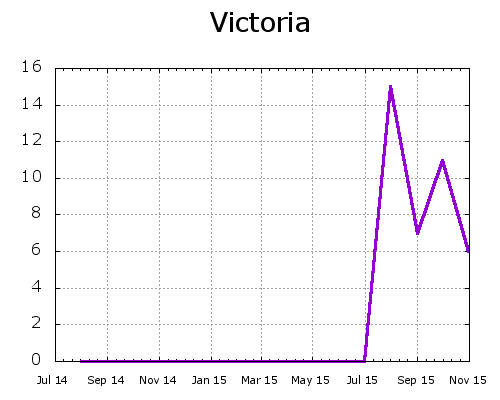
- Victoria Bar, NE Albina
- Apex Bar, SE Division
- The Vern, SE Belmont
- Rogue, Eastside
- Food Carts
- Bang Bang PDX, NE Fremont
- Matt’s BBQ, NE 50th
- Hawthorne Asylum, SE Hawthorne
- Farmhouse Carts, SE Division
- Rogue Brewery, SE Belmont
- Cascade Barrel House, SE Belmont
- Great Notion, NE Alberta
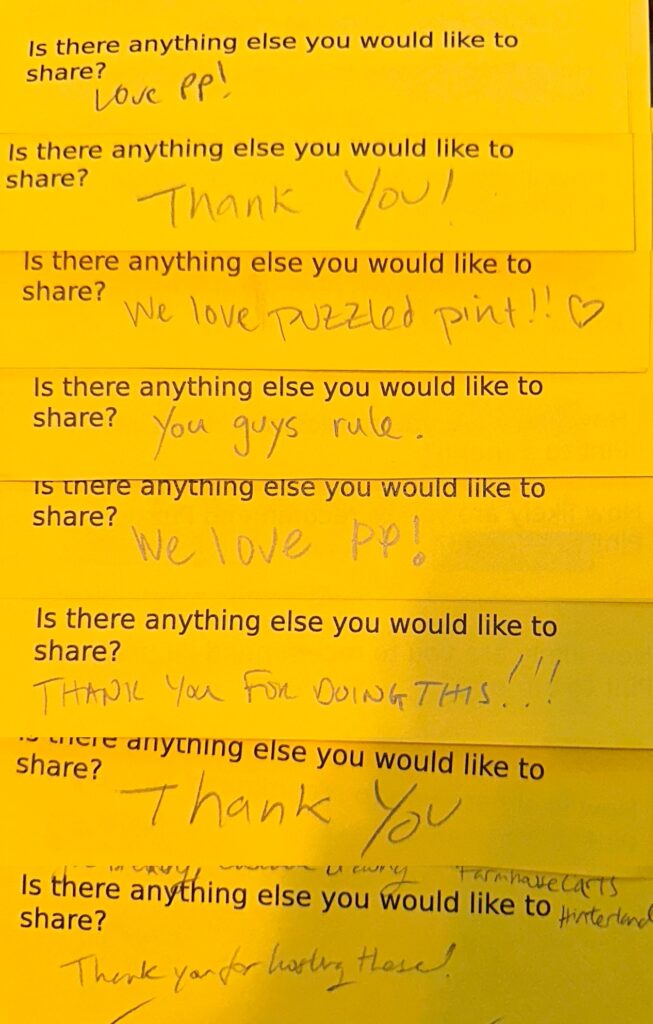
The open-ended “anything else you would like to share” question had a few specific requests:
- “Find quieter places with better food. White Owl is woefully understaffed.”
- “Vegan food options are appreciated 🙂 ”
- “I’d like places with more vegan food options.”
As far as understaffing goes, we do check with the bar before we pick one to schedule for the month. This lets the bar manager veto us showing up, if they think we’ll bring too many people for their staff to handle. It also gives them room to schedule more people for the night. Sometimes they don’t believe us (especially when we were at 120 people, rotating bars monthly, so we didn’t get a strong relationship with any specific bar). Sometimes the message gets lost between the manager we speak to and whoever’s doing scheduling. We do our best, but sometimes someone drops the ball.
As far as food options, we’re thankful that Portland bars are increasingly accommodating to all diets. We definitely try to pick bars with vegetarian items on the menu (that aren’t just “here, have some french fries”). We don’t always think to look for vegan offerings, but will try to be better about that in the future.
Finally, there was a lot of love outpouring for Puzzled Pint…