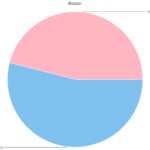
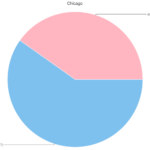
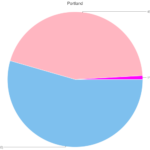
Puzzle events in Portland have, anecdotally, been a fairly even 50/50 split between men and women. Nobody has thought to tally up exact numbers, mainly because we don’t think much about it. But that has been the general consensus of gender split when discussing Portland puzzle events.
We occasionally get out-of-town visitors — familiar with Puzzled Pint in their hometown — playing here in Portland on the second Tuesday. They’re sometimes surprised at the turnout of women at the event.
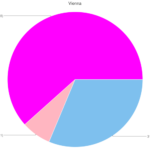
This month, we thought we’d grab some empirical data about the gender of players from all the cities out there. For the sake of simplicity, we kept the choices simple: male, female, and other/unspecified. Were I to do this again, I would have separated those two slashed options. A nonbinary gender answer is much different from an “I’d rather not say” answer. (See also: Vienna’s large percentage of this category.) I apologize if anyone felt marginalized or under-represented by this grouping.
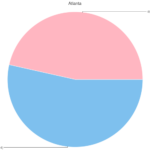
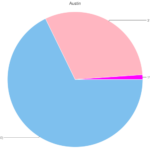
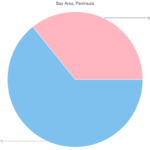
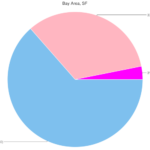
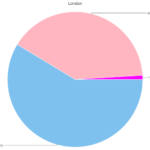
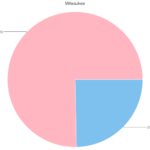
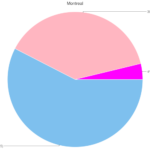
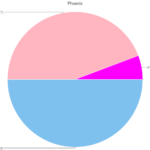
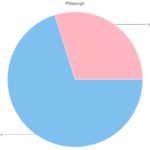
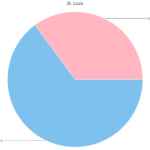
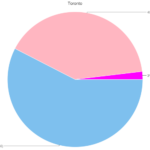
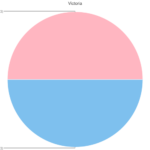
Brooklyn took the month off, and we didn’t get responses from Los Angeles or the two Seattle locations by the time this data was generated, but barring those data points here is the global result (blue==male, pink==female, magenta==other/unspecified):

If you’d like to see the results for your city, as compared to the global results (or other cities), here they are. Hover your mouse to see the city name, or click for a larger version.
In case you’d like to examine the source data or Ruby script to generate these graphs, they’re linked below. Also keep in mind that these are self-reported numbers. A few outliers were thrown out — one team used a fractional number and another team said on their answer sheet that they had 100 team members in the “other” category.
